CRYPTOUSDUA
vip
On-chain Analyst
Futures Trading Strategist
Peak Tier5
An influential figure in the crypto space and content creator on SQUARE with a community of over 88,000 subscribers!
 
🔍 Chainbase is a high-performance decentralized infrastructure platform for data handling in Web3.
📊 Solves key tasks:
• Data storage
• Real-time indexing
• Quick access to information
💡 Multi-chain support makes Chainbase a universal solution for DApps and smart contracts.
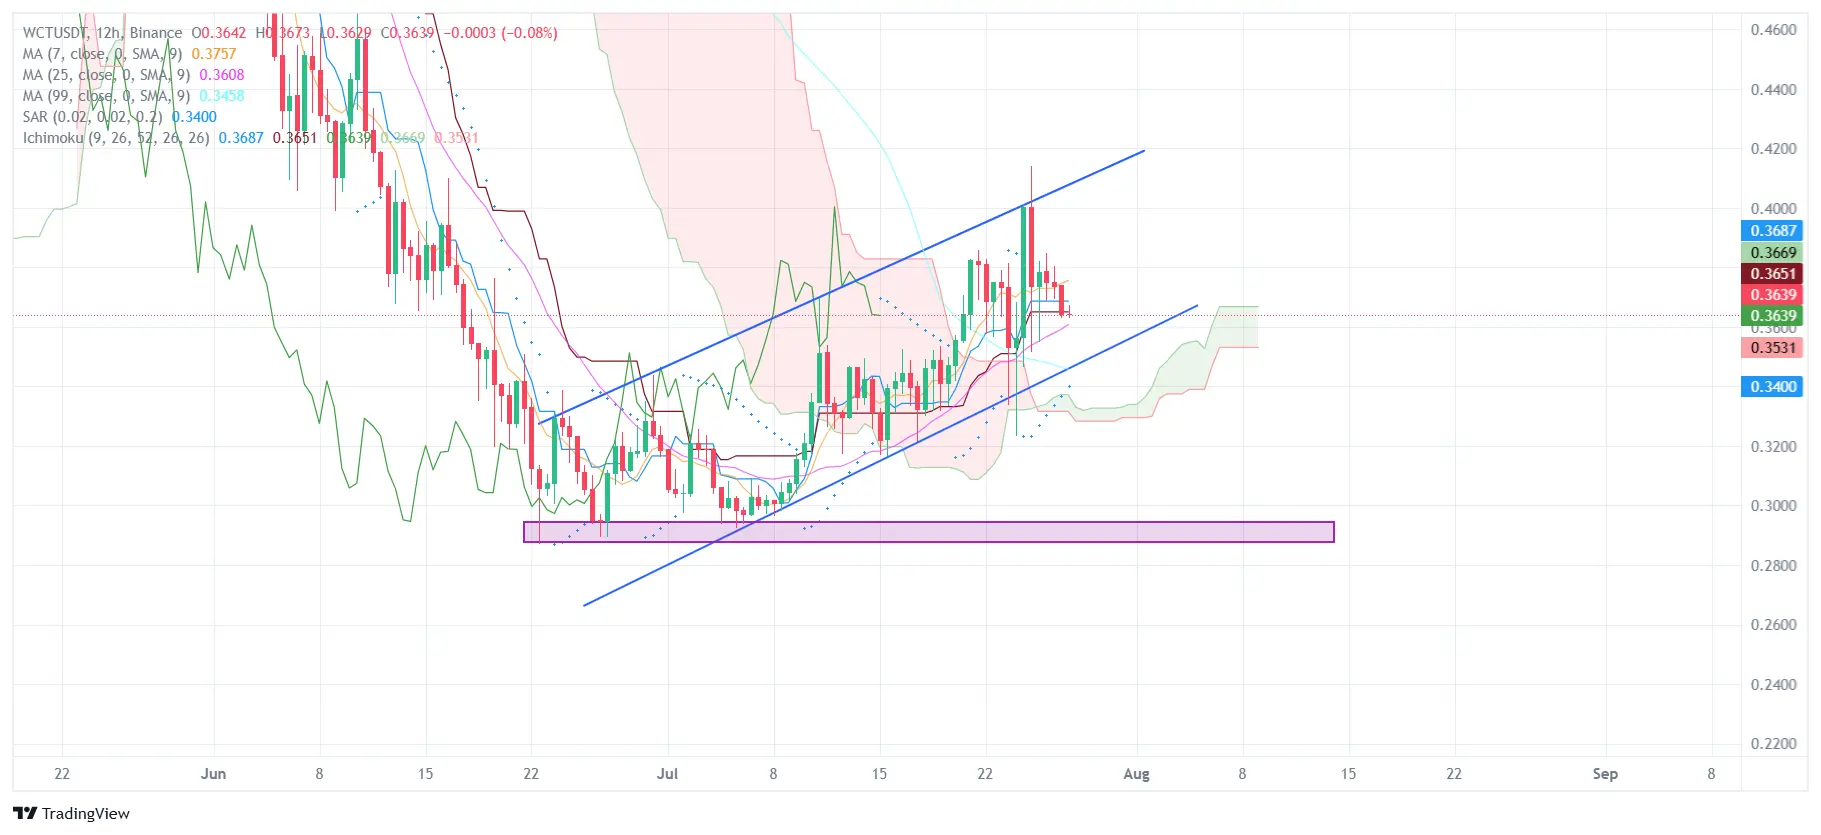
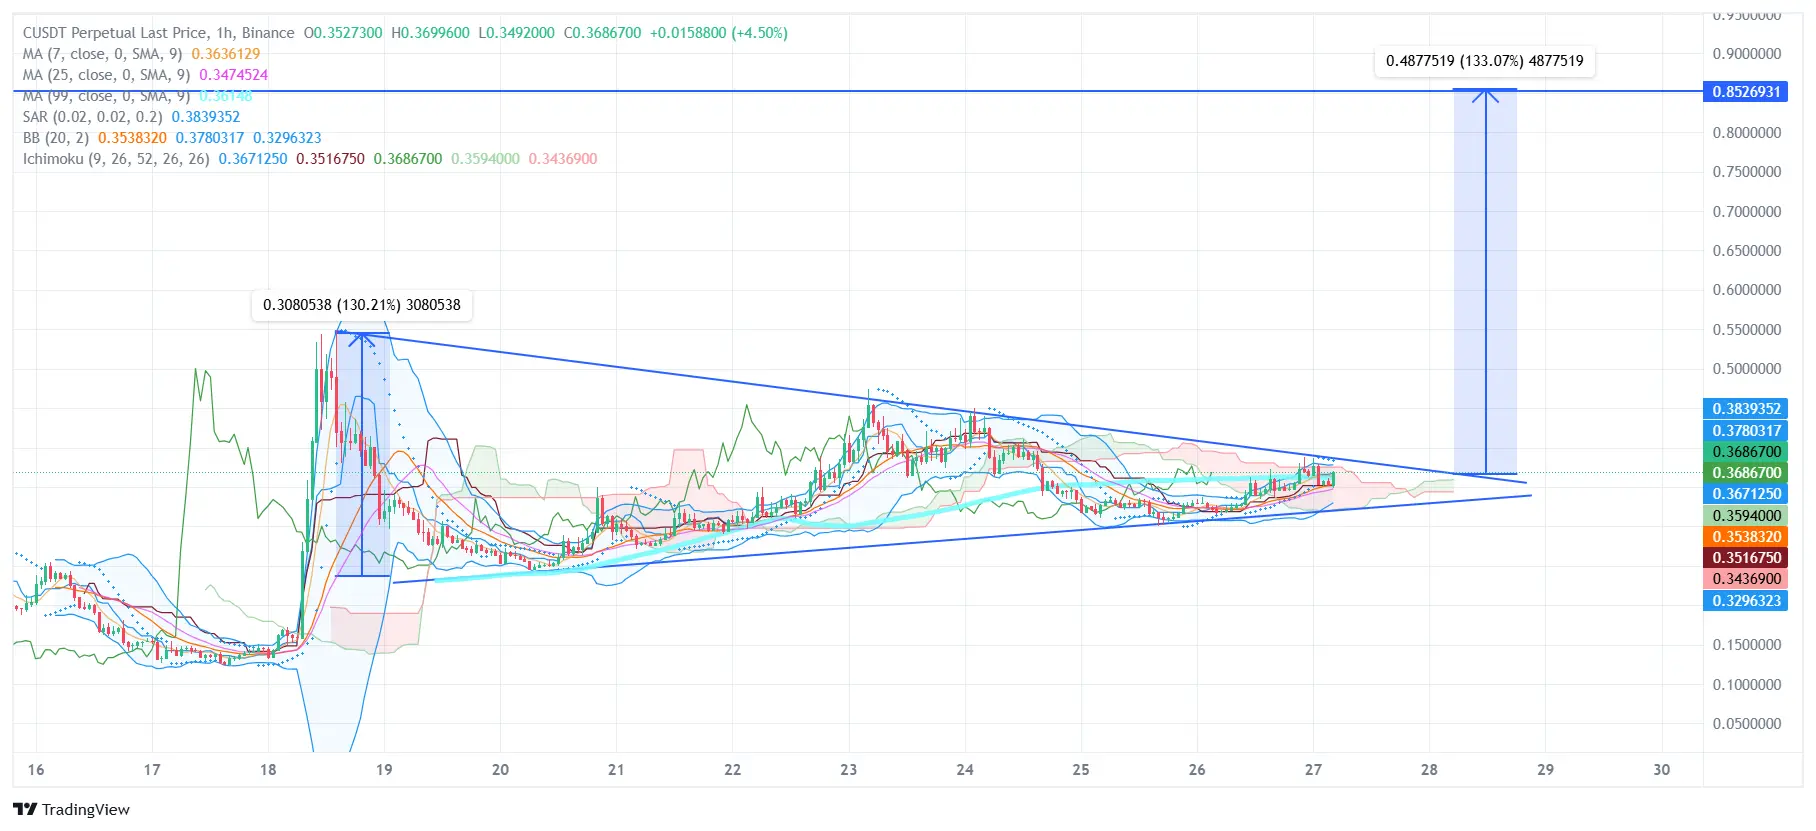
🔥 All of this works on $C — the native token of the ecosystem.
C-3.34%
View Original
  • Reward
  • Comment
  • Share
🚀 BounceBit — restart of BTC profitability
BounceBit is an innovative chain for restaking BTC, combining the capabilities of CeFi and DeFi.
💡 With the hybrid CeDeFi framework, BTC holders can earn income from multiple sources without leaving the chain.
🔒 Secure. 💰 Profitable. 🔄 Efficient.
BounceBit opens new horizons for active use of Bitcoin!
@bounce_bit #BounceBitPrime $BB
BB-4.01%
BTC-1.01%
DEFI-4.53%
View Original
  • Reward
  • Comment
  • Share
🚀 BounceBit — restart of BTC profitability
BounceBit is an innovative chain for restaking BTC, combining the capabilities of CeFi and DeFi.
💡 With the hybrid CeDeFi framework, BTC holders can earn income from multiple sources without leaving the chain.
🔒 Secure. 💰 Profitable. 🔄 Efficient.
BounceBit opens new horizons for the active use of bitcoin!
@bounce_bit #BounceBitPrime $BB
BB-4.01%
BTC-1.01%
DEFI-4.53%
View Original
  • Reward
  • Comment
  • Share
Bubblemaps — on-chain intelligence for everyone
Tired of raw data? Bubblemaps makes it lively. Simple, visual, powerful.
💥 Token Visualization
💥 Anomaly Detection
💥 Clusters, manipulations, insights
$BMT is the heart of the ecosystem, enhancing the role of the community in Intel Desk and powering the entire analytical structure.
If you're in DeFi — Bubblemaps should be in your arsenal.
#Treehouse $TREE
BMT-1.3%
DEFI-4.53%
TREE-23.07%
View Original
  • Reward
  • 1
  • Share
GateUser-50c1e0ddvip:
https://gate.com/post?post_id=12613910&tim=CgAaChoJVUFXVwMIGxEAHHBUXVcODVoGBgIO0O0O&ref=VLBMVL4MAA&ref_type=105
 
#TREE/USDT — technical analysis (1H)
The TREE asset is demonstrating consolidation after a strong spike in volatility on July 9 at 15:00 (, followed by a powerful green candle and a sharp profit-taking ). From the current level, a descending wedge/triangle is observed, indicating a likely continuation of the downward trend.
🔍 Current picture:
Price: $0.5338
MA(7): $0.5598, MA(25): $0.6258 — both moving averages are above the price, which confirms the downward pressure.
The Parabolic SAR is above the price — a bearish trend signal.
The Ichimoku cloud is above the price. The price is below th
TREE-23.07%
MA-5.87%
View Original
post-image
  • Reward
  • Comment
  • Share
Analysis of the asset ERAUSDT (4H):
🔻 Technical picture:
A descending triangle is forming, support at the level of ~$1.1140 has been broken - this is a bearish signal.
The price is trading below all moving averages (MA7, MA25, MA99), which indicates a strong downward trend.
Ichimoku:
The price confidently remains under the cloud → the bearish momentum dominates.
The cloud ahead is red - there are no signs of a turnaround.
Parabolic SAR: points above the candles → confirms the downtrend.
📌 Key levels:
Support (current zone): $1.11 (already breaking through)
Next support level: ~$1.00 – $0.95
View Original
post-image
[The user has shared his/her trading data. Go to the App to view more.]
  • Reward
  • Comment
  • Share
Analysis of the asset LAUSDT (4H):
🔹 Formation:
A narrowing triangle is forming on the chart (symmetrical), where:
Support: ~$0.3320
Resistance: descending trendline (~$0.355–$0.360)
🔹 Indicators:
Ichimoku: Price below the cloud — bearish signal, but the cloud is thin → a breakout is possible.
Parabolic SAR: Points below the candles indicate a short-term bullish signal.
MA7 / MA25 / MA99: The price breaks through MA7 and MA25, trying to hold above MA99 — an important resistance zone.
🔹 Volume and volatility:
The decrease in volatility indicates consolidation before an impulse.
Upon breaking
LA1.87%
View Original
post-image
[The user has shared his/her trading data. Go to the App to view more.]
  • Reward
  • 11
  • Share
AMIRA123vip:
Buy To Earn 💎
View More
Asset analysis BBUSDT (4H)
📊 Technical Structure:
The price moves within an ascending channel - the global trend remains bullish.
Recently, there was a false breakout of the lower boundary of the channel, but the price returned inside and is trading at around ~$0.1068.
MA7, MA25, MA99 are compressing — a zone of consolidation and potential impulse.
Ichimoku:
The price inside the cloud → phase of uncertainty.
Tenkan and Kijun are close, the price is near the cloud — a retest of the cloud or a bounce upwards is possible.
Parabolic SAR: points above the price → signal for correction or consolida
MA-5.87%
BB-4.01%
View Original
post-image
  • Reward
  • Comment
  • Share
💡 Huma Finance — the world's first PayFi protocol, where lending is based not on crypto-bail-in, but on your future income.
Accounts, salaries, transfers — all of this becomes assets against which loans can be taken.
📊 The Time-Value-of-Money model (TVM) allows for the instant evaluation and tokenization of future cash flows.
This is a step towards real-world adoption.
@humafinance #HumaFinance $HUMA
HUMA-2.24%
View Original
  • Reward
  • Comment
  • Share
🌳 Treehouse Protocol — a new step towards decentralized fixed income!
Developed by Treehouse Labs, this protocol brings fixed income tools into the on-chain space. No longer do you need to rely on CeFi — now you can manage yield directly on the blockchain.
📌 Profitability. Transparency. Decentralization.
TREE-23.07%
View Original
  • Reward
  • Comment
  • Share
Analysis of the WCT/USDT asset on the daily time frame (1D), according to the uploaded chart:
📊 Technical picture:
A symmetrical triangle is forming, indicating a consolidation phase and preparation for a strong move. The price is currently testing the lower boundary of the figure.
🔹 Indicators:
✅ MA (Moving Averages):
MA(7): 0.3629 (above the current price — short-term pressure from above).
MA(25): 0.3425 (the price broke it down).
MA(99): 0.4343 (far above — the global downtrend is still in effect).
✅ Parabolic SAR:
SAR level: 0.4140, points above the price - bearish signal.
✅ Ichimoku (Ic
WCT-3.28%
MA-5.87%
CLOUD-1.63%
View Original
  • Reward
  • Comment
  • Share
📊 Analysis of asset BB/USDT (1D):
📉 Technical picture:
The asset is trading in an ascending channel but is currently testing the lower boundary of the channel, which is critical for further movement. At the same time, a clear consolidation range has formed between the levels of 0.085–0.120.
🔹 Key levels:
Support: 0.100–0.101 ( lower boundary of the channel and Ichimoku cloud )
Resistance: 0.117–0.120 (zone of multiple pullbacks)
🔎 Indicators:
Ichimoku: price in the cloud → market in a phase of uncertainty
MA(7) = 0.1105, the price below it — short-term pressure
Parabolic SAR — points above
BB-4.01%
MA-5.87%
View Original
  • Reward
  • 1
  • Share
Bossbabyuk02vip:
thank you for your information ℹ️
🚀 eToro Launches Tokenized US Stocks on Ethereum!
Investment platform eToro has announced the launch of tokenized versions of US stocks on the Ethereum blockchain (ERC-20). The new move enables 24/7 stock trading, eliminating traditional exchanges and intermediaries.
🔹 What does this mean?
Each tokenized stock will be fully backed by a real asset and will allow investors to trade, use DeFi, and interact with Web3 applications.
🔹 Benefits:
• Access to stocks at any time
• Use of DeFi platforms for collateral and yield
• Increased liquidity and transparency
📌 This is a significant step towar
ETH-1%
MOVE-3.83%
DEFI-4.53%
STEP2.79%
  • Reward
  • Comment
  • Share
📊 Analysis of ERA/USDT (4H): Triangle Formation — Pre-Breakout Phase?
On the 4-hour chart of ERA/USDT, a symmetrical triangle is observed — a consolidation pattern preceding a strong move in one direction.
🔹 Technical picture:
🔺 Resistance is a descending line connecting local maxima.
🔻 Support - an ascending line on the minima.
💡 The triangle is narrowing, indicating an increase in volatility.
📈 Indicators:
MA 7 / 25 / 99 are grouped closely — sideways/accumulation.
Ichimoku: the price is near the cloud → consolidation without a clearly defined trend.
Parabolic SAR below the price → wea
ERA-6.77%
MA-5.87%
DYOR-1.46%
View Original
post-image
[The user has shared his/her trading data. Go to the App to view more.]
  • Reward
  • Comment
  • Share
📊 Technical Analysis BB/USDT (12H)
🔸 Price: $0.1174 (–3.61% for the period )
🔸 Structure: Clear ascending channel since the beginning of July
🔸 Last movement: The price tests the upper boundary of the channel twice without breaking through it.
📌 Indicators:
✅ MA (7) — below the current price, possible slowdown in growth
✅ MA (25) and MA (99) — support the trend from below
✅ Ichimoku:
Price above the cloud → bullish signal
The expanding green cloud ( Kumo ) reinforces the trend.
Tenkan-sen > Kijun-sen → additional confirmation
✅ Parabolic SAR — points below the price confirm the upward mom
BB-4.01%
MA-5.87%
View Original
post-image
[The user has shared his/her trading data. Go to the App to view more.]
  • Reward
  • 6
  • Share
AgentWXOvip:
Watch closely 🔍
View More
📈 WCT/USDT Analysis: Ascending Channel and Critical Decision Zone
Since the beginning of July, WCT has shown a steady recovery, forming an upward channel. However, the current position near the boundaries of the Ichimoku cloud and key resistance levels indicates a possible trend reversal.
🔹 Current price: ~0.3531 USDT
🔹 Important levels:
• Resistance — 0.3629
• Support — 0.3496 / 0.3269
📊 Technical picture:
• Moving averages (MA):
– MA(7) at 0.3687 — above the price, may become the nearest resistance
– MA(25) at 0.3419 — acts as support
– MA(99) at 0.4756 — long-term resistance
• Parabolic
WCT-3.28%
MA-5.87%
CLOUD-1.63%
View Original
post-image
[The user has shared his/her trading data. Go to the App to view more.]
  • Reward
  • 3
  • Share
Avocado312vip:
dip dip dip dip dip
dip dip dip dip dip
dip dip dip dip dip
View More
📊 Technical Analysis BB/USDT (12H)
🔸 Price: $0.1174 (–3.61% over the period )
🔸 Structure: Clear ascending channel since the beginning of July
🔸 Last movement: The price tests the upper boundary of the channel twice without breaking through it.
📌 Indicators:
✅ MA (7) — below the current price, possible slowdown in growth
✅ MA (25) and MA (99) — support the trend from below
✅ Ichimoku:
Price above the cloud → bullish signal
The expanding green cloud (Kumo) strengthens the trend.
Tenkan-sen > Kijun-sen → additional confirmation
✅ Parabolic SAR — points below the price confirm the upward mom
BB-4.01%
MA-5.87%
GT-0.83%
View Original
post-image
  • Reward
  • 18
  • Share
AviSinghvip:
hold the zp coin because of zp is the best project.
View More
🚀 ETH has exceeded $460 billion in market cap!
Ethereum is confidently strengthening its position in the market, having exceeded the market cap of $460,000,000,000. This highlights the high demand for ETH, the growing interest in DeFi, L2 and ETH ETF.
🟩 The network is active
📈 Institutions are entering
🔥 ETH is not just an alt, it is the digital infrastructure of the future.
#Ethereum # ETH #CryptoMarket # DeFi #Web3
ETH-1%
DEFI-4.53%
NOT-3.77%
ALT-6.48%
[The user has shared his/her trading data. Go to the App to view more.]
  • Reward
  • Comment
  • Share
📊 Technical Analysis WCTUSDT (12H)
Current price: ~0.3639 USDT Dynamics: Consolidation after growth, testing the lower boundary of the ascending channel
🔍 Key Indicators:
MA(7): 0.3757 — above the current price, forming local resistance
MA(25): 0.3608 — near the price, it may act as a short-term support.
MA(99): 0.3458 — global support
Parabolic SAR: 0.3400 — below the price, bullish momentum is maintained
Ichimoku:
Tenkan-sen: 0.3651
Kijun-sen: 0.3669
Cloud: 0.3531 – 0.3687 — the price is in the cloud → zone of uncertainty
🧱 Levels:
Resistance 1: ~0.3757 (MA7)
Resistance 2: ~0.3687 (upper
MA-5.87%
View Original
post-image
  • Reward
  • 6
  • Share
SCRPIONvip:
thank you for the information
View More
📊 Technical Analysis CUSDT Perpetual (1H)Price: 0.30805🚀 Growth: +130.21%, strong upward momentum.
🔍 Indicators:
MA (7): 0.3636
MA (25): 0.3475
MA (99): 0.3516
Bollinger Bands:
Lower: 0.3296
Average: 0.3538
Upper: 0.3780
Parabolic SAR: 0.3839 — above the price, bearish signal
Ichimoku:
Tenkan-sen: 0.3671
Kijun-sen: 0.3517
Cloud: 0.3594 – 0.3687 (resistance)
📈 Levels:
Resistance: 0.3687 (cloud), 0.3780 (upper BB)
Support: 0.3538 (average BB), 0.3475 (MA25), 0.3296 (lower BB)
🎯 Trading Scenarios:
Bullish: Close > 0.3687 + breakout SAR → target 0.403–0.420
Bearish: Rebound from 0.3780 → shor
MA-5.87%
BB-4.01%
GT-0.83%
View Original
post-image
  • Reward
  • Comment
  • Share
  • Topic
    1/3
  • Pin
Trade Crypto Anywhere Anytime
qrCode
Scan to download Gate app
Community
English
  • 简体中文
  • English
  • Tiếng Việt
  • 繁體中文
  • Español
  • Русский
  • Français (Afrique)
  • Português (Portugal)
  • Bahasa Indonesia
  • 日本語
  • بالعربية
  • Українська
  • Português (Brasil)